From data to decisions. Automatically.
Predictive models, scenario planning, and production reporting turn raw monitoring data into optimized harvest timing, treatment decisions, and growth forecasts.
14-day
Predictive forecast window
Scenario
What-if harvest planning
Automated
Daily production reports
API
Full data export
How It Works - Three steps to analytics & decision support intelligence.
Collect
All module data — population, feeding, health, behavior, environment — flows into the analytics engine.
Model
Machine learning models forecast growth trajectories, predict health events, and optimize production schedules.
Plan
Interactive scenario planning lets you simulate harvest timing, treatment interventions, and stocking changes.
Capabilities - What Analytics & Decision Support delivers.
14-day growth forecast
Per-pen growth trajectory predictions based on current feeding and environmental conditions.
Harvest timing optimization
Target weight vs market timing analysis for optimal harvest scheduling.
Treatment scenario planning
Simulate delousing timing, medication windows, and treatment impacts on growth.
MAB tracking
Maximum Allowable Biomass monitoring and forecasting for regulatory compliance.
Feed budget optimization
Cross-pen feed allocation to maximize growth while minimizing waste.
Production KPI dashboards
FCR, SGR, survival rate, and biomass density — all production metrics in one view.
Automated reporting
Daily, weekly, and monthly production reports generated automatically.
Cross-pen comparison
Performance benchmarking across pens to identify best practices and problem areas.
Seasonality detection
Historical trend analysis revealing seasonal patterns in growth, feeding, and welfare.
Anomaly detection
Statistical anomaly flagging across all metrics with configurable thresholds.
REST API export
Full programmatic access to all data for custom integrations and BI tools.
Report generation
CSV, Excel, and formatted PDF reports for stakeholders and compliance.
Webhook alerts
Real-time notifications when any metric crosses configured thresholds.
ERP integration
Connect with farm management and ERP systems for seamless data flow.
Use Cases - Analytics & Decision Support in action.
Production planners
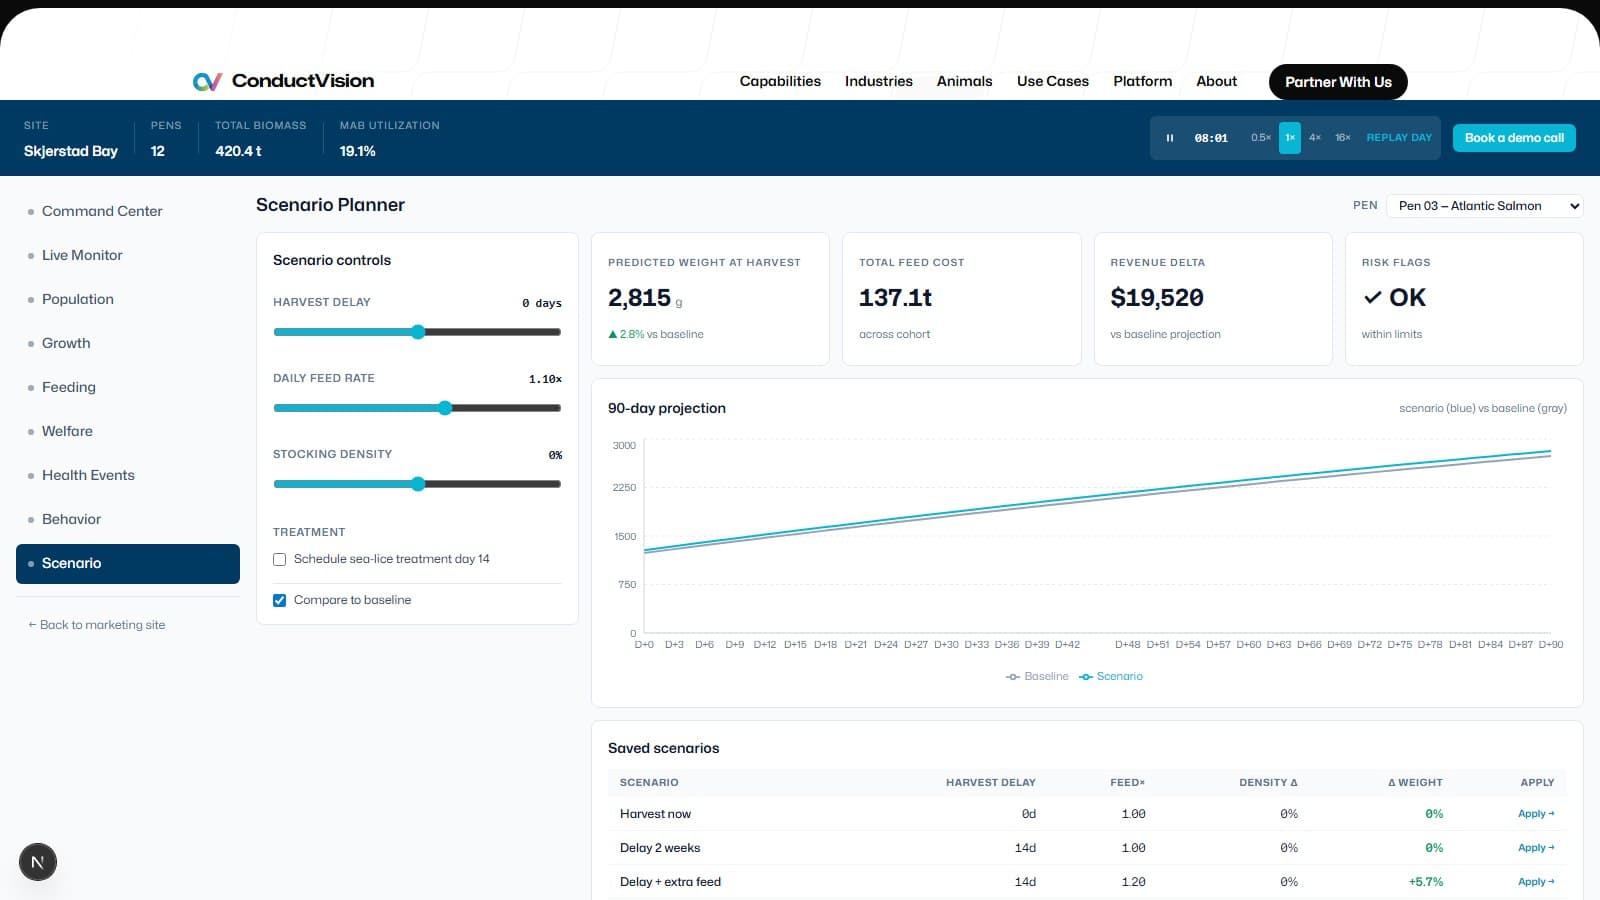
Simulate "what if we harvest pen 3 next week vs in 3 weeks?" with predicted weight, feed cost, and market price.
Compliance officers
Automated MAB tracking and reporting for regulatory requirements.
Business analysts
Full API access to feed data into existing BI tools — Power BI, Tableau, or custom dashboards.
Platform - See it in action.

Scenario Planner
Interactive harvest timing and treatment simulation interface
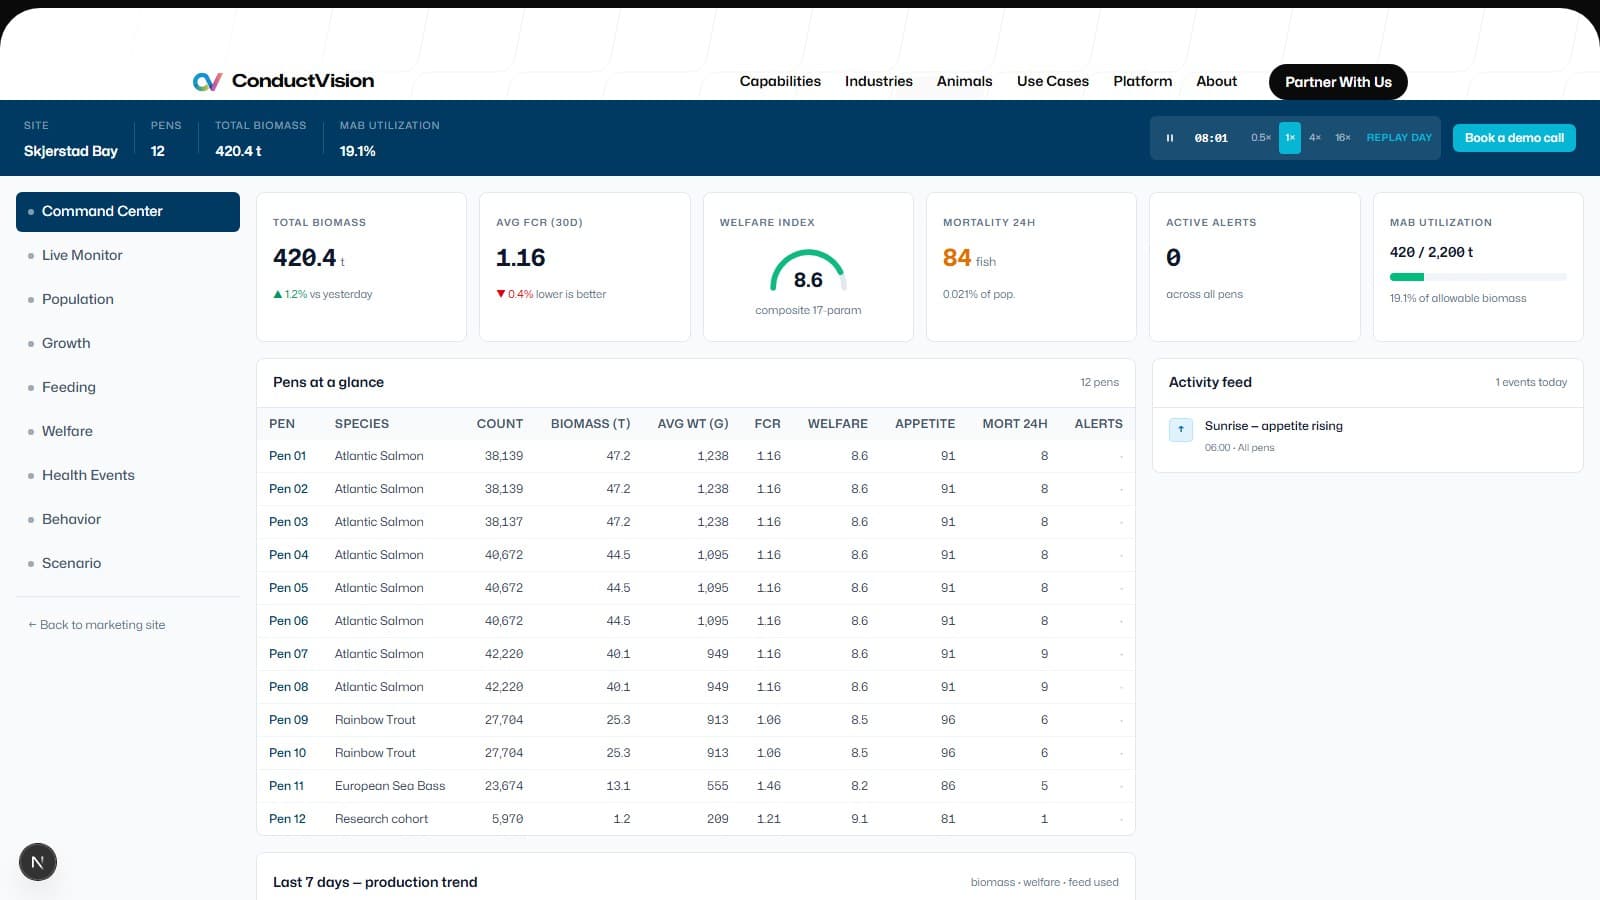
Production KPIs
Cross-pen performance comparison with trend analysis
Species Support - Calibrated per species.
FAQ - Analytics & Decision Support FAQ
Can't find the answer you're looking for? Reach out to our support team.
Forecast accuracy improves with data history. After 2–4 weeks of calibration, 14-day growth forecasts typically track within ±5% of actual outcomes. Accuracy depends on environmental stability and data coverage.
Yes. The REST API provides full access to all metrics in JSON format. We also support direct CSV/Excel exports and webhook integrations for real-time data streaming to Power BI, Tableau, or custom dashboards.
Scenario planning lets you model "what-if" questions: What if we harvest pen 3 next week? What if we delay treatment by 5 days? The system simulates outcomes using current growth, feed, and health data to help you make informed decisions.
The system continuously calculates biomass per pen and per site, tracking it against your regulatory Maximum Allowable Biomass limits. Forecasting shows when you will approach limits, giving you time to plan harvest or transfers.
Still have questions? We are happy to talk it through.
Explore - Other aquaculture capabilities.
Ready to get started?
Book a demo to see analytics & decision support intelligence in action for your operation.