
Understand what your fish are telling you.
Research-grade behavioral analysis reveals stress, disease, and environmental responses through swim patterns, schooling dynamics, and activity cycles.
Sub-second
Behavioral event detection
Research-grade
Peer-reviewed precision
24/7
Continuous behavioral profiling
Multi-species
Species-specific baselines
How It Works - Three steps to behavioral analytics intelligence.
Track
Individual and group tracking algorithms follow fish movement patterns frame by frame.
Classify
Behavioral classifiers identify normal vs abnormal patterns: swim speed, swim tilt, schooling cohesion, surface breaks, and resting behavior.
Correlate
Behavioral data integrates with environmental sensors to reveal causal patterns: temperature spike → swimming speed increase → reduced feeding.
Capabilities - What Behavioral Analytics delivers.
Individual swim speed
Per-fish velocity measurement calibrated to body-lengths-per-second.
Swim tilt angle detection
Vertical orientation changes indicating stress, disease, or buoyancy issues.
Schooling cohesion metrics
Inter-fish distance and alignment quantifying group coordination.
Breathing rate estimation
Opercular movement frequency measured from close-pass camera observations.
Surface break frequency
Gasping behavior detection correlated with dissolved oxygen levels.
Circling and wall-following
Stereotypic stress behaviors detected through trajectory analysis.
Lethargy scoring
Reduced movement quantified against species-specific activity baselines.
Diurnal activity profiling
Day-night behavioral cycle mapping revealing circadian disruptions.
Startle response measurement
Reaction speed and magnitude to environmental stimuli.
Group velocity and direction
Pen-level swimming patterns showing collective behavioral state.
Behavioral anomaly detection
Automatic alerting when behavioral metrics deviate from established baselines.
Environmental correlation
Cross-reference behavior with temperature, O₂, salinity, and light levels.
Baseline establishment
Per-species, per-environment behavioral baselines built during calibration.
Longitudinal trend tracking
Behavioral trends over weeks and months revealing gradual changes.
Use Cases - Behavioral Analytics in action.
Early disease detection
Behavioral changes precede visible symptoms by days. Detect swim pattern anomalies before mortality events.
Environmental optimization
Correlate behavioral metrics with water parameters to find the optimal conditions for each species.
Research and breeding
Quantify behavioral phenotypes for selective breeding programs. Automated ethogram generation.
Platform - See it in action.
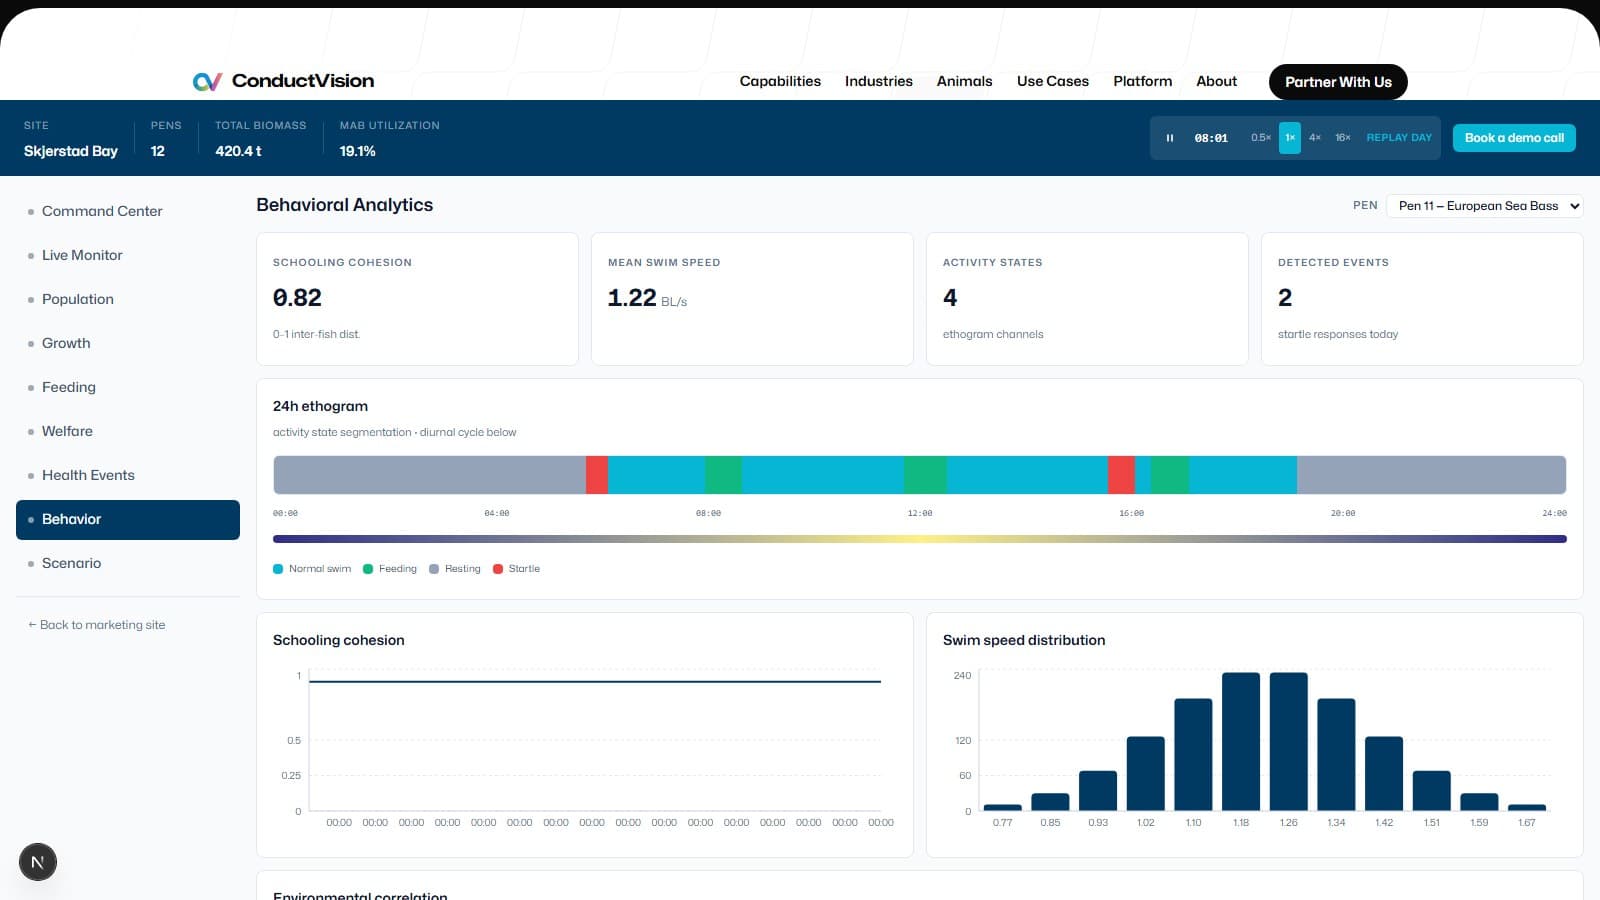
Behavioral Dashboard
Real-time behavioral metrics with environmental correlation overlays
Species Support - Calibrated per species.
FAQ - Behavioral Analytics FAQ
Can't find the answer you're looking for? Reach out to our support team.
Basic swim tracking gives you position data. ConductVision performs ethological analysis — classifying behaviors, detecting anomalies against species-specific baselines, and correlating behavioral changes with environmental factors. This is the same analytical depth used in published behavioral neuroscience research.
Behavioral changes often precede visible disease symptoms by 2–5 days. Changes in swim speed, schooling cohesion, and surface break frequency can serve as early indicators. The system flags these deviations automatically.
Behavioral phenotyping allows breeders to select for desirable behavioral traits — growth-correlated activity levels, stress resilience, feeding efficiency — in addition to traditional morphological criteria. The system generates automated ethograms for each cohort.
Yes, with infrared or low-light cameras. The system profiles diurnal activity cycles and can detect circadian disruptions caused by artificial lighting changes, environmental stress, or disease.
Still have questions? We are happy to talk it through.
Explore - Other aquaculture capabilities.
Ready to get started?
Book a demo to see behavioral analytics intelligence in action for your operation.